
List of countries by GDP (PPP)
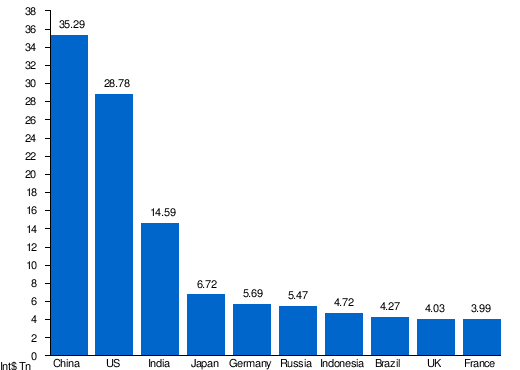 |
| Largest economies in the world by PPP GDP in 2024 according to International Monetary Fund forecast[1] |
_2022_World_Map_(June_2024_Recolor).svg)
GDP (PPP) means gross domestic product based on purchasing power parity. This article includes a list of countries by their forecast estimated GDP (PPP).[2] Countries are sorted by GDP (PPP) forecast estimates from financial and statistical institutions that calculate using market or government official exchange rates. The data given on this page are based on the international dollar, a standardized unit used by economists. Certain regions that are not widely considered countries such as Hong Kong also show up in the list if they are distinct jurisdiction areas or economic entities.
GDP comparisons using PPP are arguably more useful than those using nominal GDP when assessing the domestic market of a state because PPP takes into account the relative cost of local goods, services and inflation rates of the country, rather than using international market exchange rates, which may distort the real differences in per capita income.[3] It is however limited when measuring financial flows between countries and when comparing the quality of same goods among countries.[4] PPP is often used to gauge global poverty thresholds and is used by the United Nations in constructing the human development index.[3] These surveys such as the International Comparison Program include both tradable and non-tradable goods in an attempt to estimate a representative basket of all goods.[3]
The first set of data on the left columns of the table includes estimates for the year 2023 made for each economy of the 196 economies (189 U.N. member states and 7 areas of Aruba, Hong Kong, Kosovo, Macau, Palestine, Puerto Rico, and Taiwan) covered by the International Monetary Fund (IMF)'s International Financial Statistics (IFS) database. The data is in millions of international dollars and was calculated and published by the IMF in October 2023. The second table includes data, mostly for the year 2022, for 180 of the 193 current United Nations member states as well as Hong Kong and Macau (the two Chinese Special Administrative Regions). Data are in millions of international dollars; they were compiled by the World Bank. The third table is a tabulation of the CIA World Factbook GDP (PPP) data update of 2019. The data for GDP at purchasing power parity has also been rebased using the new International Comparison Program price surveys and extrapolated to 2007. Non-sovereign entities (the world, continents, and some dependent territories) and states with limited recognition (such as Kosovo, Palestine and Taiwan) are included in the list in cases in which they appear in the sources. These economies are not ranked in the charts here, but are listed in sequence by GDP for comparison. In addition, non-sovereign entities are marked in italics.
Table
The table is initially ranked by the average of the available estimates for each country or territory, and can be reranked by either of the sources.
The links in the "Country/Territory" row of the following table link to the article on the GDP or the economy of the respective country or territory.
| Country (or territory) | IMF[1][5] | World Bank[6] | CIA[7][8][9] | |||
|---|---|---|---|---|---|---|
| Forecast | Year | Estimate | Year | Estimate | Year | |
| World | 185,677,122 | 2024 | 184,653,697 | 2023 | 127,800,000 | 2017 |
| 35,291,015 | [n 1]2024 | 34,643,706 | [n 2]2023 | 23,009,780 | [n 1]2020 | |
| 28,781,083 | 2024 | 27,360,935 | 2023 | 19,846,720 | 2020 | |
| 14,594,460 | 2024 | 14,537,383 | 2023 | 8,443,360 | 2020 | |
| 6,720,962 | 2024 | 6,251,558 | 2023 | 5,224,850 | 2019 | |
| 5,686,531 | 2024 | 5,857,856 | 2023 | 4,238,800 | 2020 | |
| 5,472,880 | 2024 | 6,452,309 | 2023 | 3,875,690 | 2020 | |
| 4,720,542 | 2024 | 4,333,084 | 2023 | 3,130,470 | 2020 | |
| 4,273,668 | 2024 | 4,454,930 | 2023 | 2,989,430 | 2020 | |
| 4,029,438 | 2024 | 4,026,241 | 2023 | 2,797,980 | 2020 | |
| 3,987,911 | 2024 | 4,169,071 | 2023 | 2,832,170 | 2020 | |
| 3,831,533 | 2024 | 3,767,230 | 2023 | 3,180,984 | 2022 | |
| 3,434,224 | 2024 | 3,288,671 | 2023 | 2,306,320 | 2020 | |
| 3,347,103 | 2024 | 3,452,505 | 2023 | 2,322,140 | 2020 | |
| 3,057,995 | 2024 | 2,794,196 | 2023 | 2,187,800 | 2020 | |
| 2,516,376 | 2024 | 2,553,107 | 2023 | 1,714,860 | 2020 | |
| 2,472,227 | 2024 | 2,469,314 | 2023 | 1,742,790 | 2020 | |
| 2,354,392 | 2024 | 2,031,780 | 2023 | 1,543,240 | 2020 | |
| 1,898,538 | 2024 | 2,120,932 | 2023 | 1,223,040 | 2020 | |
| 1,854,845 | 2024 | 1,598,124 | 2023 | 1,044,310 | 2020 | |
| 1,800,540 | 2024 | 1,814,628 | 2023 | 1,223,460 | 2020 | |
| 1,792,349 | 2024 | — | 1,143,277 | 2019 | ||
| 1,791,358 | 2024 | 1,841,115 | 2023 | 1,201,210 | 2020 | |
| 1,644,322 | 2024 | 1,681,795 | 2023 | 1,206,620 | 2020 | |
| 1,642,572 | 2024 | 1,493,905 | 2023 | 1,020,000 | 2020 | |
| 1,619,803 | 2024 | 1,567,951 | 2023 | 793,490 | 2020 | |
| 1,558,898 | 2024 | 1,502,096 | 2023 | 798,210 | 2020 | |
| 1,443,708 | 2024 | 1,414,033 | 2023 | 1,013,530 | 2020 | |
| 1,391,800 | 2024 | 1,262,021 | 2023 | 871,560 | 2020 | |
| 1,329,039 | 2024 | 1,398,445 | 2023 | 945,480 | 2020 | |
| 1,305,942 | 2024 | 1,277,913 | 2023 | 855,600 | 2020 | |
| 1,244,646 | 2024 | 1,369,904 | 2023 | 893,310 | 2020 | |
| 1,041,705 | 2024 | 1,122,331 | 2023 | 683,940 | 2020 | |
| 1,025,930 | 2024 | 957,414 | 2023 | 680,040 | 2020 | |
| 948,045 | 2024 | 798,490 | 2023 | 655,790 | 2019 | |
| 817,986 | 2024 | 912,851 | 2023 | 556,070 | 2020 | |
| 816,456 | 2024 | 822,862 | 2023 | 590,710 | 2020 | |
| 803,166 | 2024 | 832,972 | 2023 | 557,110 | 2020 | |
| 794,179 | 2024 | 837,348 | 2023 | 719,080 | 2022 | |
| 768,521 | 2024 | 776,539 | 2023 | 468,400 | 2020 | |
| 736,398 | 2024 | 739,741 | 2023 | 524,750 | 2020 | |
| 712,056 | 2024 | 671,603 | 2023 | 447,970 | 2020 | |
| 693,415 | 2024 | 782,723 | 2023 | 475,180 | 2020 | |
| 634,362 | 2024 | 673,525 | 2023 | 463,120 | 2020 | |
| 622,779 | 2024 | 653,360 | 2023 | 445,880 | 2020 | |
| 570,082 | 2024 | 538,692 | 2023 | 420,130 | 2020 | |
| 566,582 | 2024 | 574,287 | 2023 | 371,290 | 2020 | |
| 552,151 | 2024 | 521,339 | 2023 | 353,390 | 2020 | |
| 551,958 | 2024 | 585,187 | 2023 | 409,970 | 2020 | |
| 530,861 | 2024 | 635,633 | 2023 | 372,270 | 2020 | |
| 515,947 | [n 3]2024 | 621,258 | [n 3]2023 | 516,680 | [n 3]2020 | |
| 485,742 | 2024 | 513,203 | 2023 | 331,640 | 2020 | |
| 462,019 | 2024 | 456,059 | 2023 | 326,200 | 2020 | |
| 461,107 | 2024 | 576,575 | 2023 | 342,060 | 2020 | |
| 437,767 | 2024 | 440,579 | 2023 | 302,320 | 2020 | |
| 431,688 | 2024 | 393,407 | 2023 | 264,050 | 2020 | |
| 430,125 | 2024 | 426,748 | 2023 | 292,400 | 2020 | |
| 409,073 | 2024 | 374,409 | 2023 | 259,420 | [n 4]2020 | |
| 401,838 | 2024 | 354,100 | 2023 | 239,420 | 2020 | |
| 365,854 | 2024 | 348,430 | 2023 | 226,940 | 2020 | |
| 340,043 | 2024 | 363,315 | 2023 | 261,390 | 2020 | |
| 337,521 | 2024 | 326,445 | 2023 | 245,660 | 2020 | |
| 319,248 | 2022 | 318,551 | 2023 | 274,800 | 2020 | |
| 293,365 | 2024 | 290,243 | 2023 | 184,450 | 2020 | |
| 285,582 | 2024 | 282,620 | 2023 | 215,600 | 2020 | |
| 283,572 | 2024 | 322,296 | 2023 | 247,240 | [n 5]2020 | |
| 270,981 | 2024 | 294,960 | 2023 | 203,710 | 2020 | |
| 268,199 | 2024 | 288,687 | 2023 | 182,240 | 2020 | |
| 264,301 | 2024 | 243,031 | 2023 | 209,740 | 2019 | |
| 244,363 | 2024 | 259,661 | 2023 | 152,790 | 2020 | |
| 241,450 | 2024 | 254,767 | 2023 | 164,840 | 2020 | |
| 239,326 | 2024 | 242,305 | 2023 | 165,570 | 2020 | |
| 234,661 | 2024 | 282,246 | 2023 | 179,970 | 2020 | |
| 229,107 | 2024 | 248,788 | 2023 | 155,060 | 2020 | |
| 224,526 | 2024 | 506,339 | 2011 | 269,068 | 2018 | |
| 219,391 | 2024 | 224,945 | 2023 | 136,480 | 2020 | |
| 213,276 | 2024 | 247,604 | 2023 | 141,500 | 2020 | |
| 207,604 | 2024 | 206,309 | 2023 | 135,790 | 2019 | |
| 202,013 | 2024 | 177,361 | 2023 | 109,520 | 2020 | |
| 199,195 | 2024 | 239,521 | 2023 | 138,510 | 2020 | |
| 185,014 | 2024 | 181,345 | 2023 | 125,800 | 2020 | |
| 182,897 | 2024 | 135,295 | 2023 | 70,650 | 2020 | |
| 175,269 | 2024 | 176,899 | 2023 | 107,110 | 2020 | |
| 169,189 | 2024 | 150,925 | 2023 | 176,400 | 2020 | |
| 168,315 | 2024 | 170,448 | 2023 | 114,970 | 2020 | |
| 160,197 | 2024 | 170,865 | 2023 | 96,030 | 2020 | |
| 159,139 | 2024 | 160,101 | 2023 | 110,720 | 2020 | |
| 156,696 | 2024 | 150,513 | 2023 | 99,610 | 2020 | |
| 152,141 | 2024 | 145,693 | 2023 | 100,250 | 2020 | |
| 144,585 | 2024 | 148,985 | 2023 | 102,660 | 2020 | |
| 142,392 | 2024 | 95,300 | 2023 | 70,080 | 2020 | |
| 141,929 | 2024 | 154,126 | 2023 | 94,940 | 2020 | |
| 141,191 | 2024 | 118,493 | 2023 | 100,160 | 2020 | |
| — | — | 137,000 | 2017 | |||
| 136,921 | 2024 | 152,910 | 2023 | 106,820 | 2020 | |
| 136,379 | 2020 | 62,150 | 2021 | 50,280 | 2015 | |
| 131,422 | 2024 | 132,892 | 2023 | 92,590 | 2020 | |
| 130,172 | 2024 | 105,309 | 2019 | 92,330 | 2019 | |
| 124,726 | 2024 | 119,842 | 2023 | 87,980 | 2020 | |
| 112,913 | 2024 | 116,540 | 2023 | 76,750 | 2020 | |
| 107,946 | 2024 | 116,596 | 2023 | 75,060 | 2020 | |
| 101,549 | 2024 | 94,846 | 2023 | 69,650 | 2020 | |
| 96,886 | 2024 | 86,117 | 2021 | 69,720 | 2020 | |
| 94,020 | [n 6]2024 | 92,810 | [n 6]2023 | 52,330 | [n 6]2020 | |
| 92,885 | 2024 | 79,697 | 2023 | 35,580 | 2020 | |
| 92,175 | 2024 | 84,863 | 2023 | 60,120 | 2020 | |
| 86,978 | 2024 | 85,849 | 2023 | 55,260 | 2020 | |
| 80,151 | 2024 | 79,831 | 2023 | 52,260 | 2020 | |
| 79,975 | 2024 | 76,388 | 2023 | 50,890 | 2020 | |
| 78,713 | 2024 | 71,194 | 2023 | 56,790 | 2020 | |
| 78,421 | 2024 | 79,976 | 2023 | 56,920 | 2020 | |
| 78,166 | 2022 | 70,557 | 2022 | 79,510 | 2020 | |
| 72,512 | 2022 | 86,077 | 2022 | 77,040 | 2020 | |
| 71,254 | 2024 | 73,353 | 2023 | 47,050 | 2020 | |
| 69,535 | 2024 | 92,755 | 2013 | 73,630 | 2017 | |
| 66,910 | 2024 | 63,405 | 2023 | 45,160 | 2022 | |
| 65,413 | 2024 | 63,497 | 2023 | 44,890 | 2020 | |
| 64,432 | 2024 | 64,044 | 2023 | 37,310 | 2020 | |
| 64,413 | 2024 | 58,256 | 2023 | 40,290 | 2020 | |
| 63,822 | 2024 | 44,974 | 2023 | 14,690 | 2020 | |
| 61,598 | 2024 | 66,932 | 2023 | 47,440 | 2020 | |
| 60,551 | 2024 | 56,864 | 2023 | 41,820 | 2020 | |
| 59,415 | 2024 | 51,551 | 2023 | 34,880 | 2020 | |
| 58,795 | 2024 | 58,750 | 2023 | 37,730 | 2020 | |
| 58,580 | 2024 | 62,421 | 2023 | 37,600 | 2020 | |
| 57,466 | 2024 | 56,171 | 2023 | 38,420 | 2020 | |
| 54,890 | 2024 | 56,678 | 2023 | 34,980 | 2020 | |
| 54,657 | 2024 | 51,856 | 2023 | 37,720 | 2020 | |
| 54,104 | [n 7]2024 | 53,033 | [n 7]2023 | 33,670 | [n 7]2020 | |
| 51,894 | 2024 | 62,855 | 2023 | 35,080 | 2020 | |
| 49,035 | 2024 | 64,993 | 2023 | 40,790 | 2020 | |
| 48,301 | 2024 | 35,996 | 2023 | 24,970 | 2020 | |
| 48,054 | 2024 | 50,435 | 2023 | 31,020 | 2020 | |
| 47,024 | 2024 | 49,436 | 2023 | 28,970 | 2020 | |
| 46,679 | 2024 | 48,461 | 2023 | 33,210 | 2020 | |
| 46,658 | 2024 | 47,373 | 2023 | 27,180 | 2020 | |
| 45,905 | 2024 | 45,068 | 2023 | 33,020 | 2020 | |
| 44,300 | 2024 | 47,593 | 2023 | 36,690 | 2020 | |
| 43,915 | 2024 | 53,475 | 2023 | 32,050 | 2020 | |
| 43,882 | [n 8]2024 | 43,233 | [n 8]2023 | 32,260 | [n 8]2020 | |
| 40,468 | 2024 | 37,198 | 2023 | 24,640 | 2020 | |
| 40,029 | 2024 | 39,093 | 2023 | 28,440 | 2020 | |
| — | — | 40,000 | 2015 | |||
| 38,506 | 2024 | 38,170 | 2023 | 31,620 | 2020 | |
| 37,239 | 2024 | 32,423 | 2023 | 25,890 | 2020 | |
| 36,870 | 2024 | 34,545 | 2023 | 20,600 | 2020 | |
| 34,779 | 2024 | 33,721 | 2023 | 23,170 | 2020 | |
| 34,249 | 2024 | 39,118 | 2023 | 27,230 | 2020 | |
| 34,027 | 2024 | 29,234 | 2023 | 13,190 | 2020 | |
| 33,173 | [n 9]2023 | 30,418 | [n 9]2023 | 25,910 | [n 10]2020 | |
| 32,302 | 2024 | 33,220 | 2023 | 22,600 | 2020 | |
| 29,904 | 2024 | 42,338 | 2023 | 19,030 | 2020 | |
| 29,719 | 2024 | 26,397 | 2023 | 19,130 | 2020 | |
| 29,226 | 2024 | 32,104 | 2023 | 23,860 | 2020 | |
| 29,077 | 2024 | 30,530 | 2023 | 19,160 | 2020 | |
| 27,039 | 2024 | 28,567 | 2023 | 17,450 | 2020 | |
| 18,989 | 2024 | 14,670 | 2023 | 12,100 | 2020 | |
| 18,942 | 2024 | 16,234 | 2023 | 13,150 | 2020 | |
| 18,812 | 2024 | 19,234 | 2023 | 11,360 | 2020 | |
| 16,059 | 2024 | 14,089 | 2023 | 9,860 | 2020 | |
| 15,124 | 2024 | 12,925 | 2023 | 7,050 | 2020 | |
| 14,861 | 2024 | 14,216 | 2023 | 9,740 | 2020 | |
| 12,377 | 2024 | 11,753 | 2022 | 8,420 | 2020 | |
| 12,248 | 2024 | 13,117 | 2023 | 9,460 | 2020 | |
| 12,241 | 2024 | 12,588 | 2023 | 8,690 | 2020 | |
| — | — | 11,110 | 2017 | |||
| 10,468 | 2024 | 9,856 | 2023 | 6,850 | 2020 | |
| 8,151 | 2024 | 8,770 | 2023 | 5,220 | 2020 | |
| 8,038 | 2024 | 8,187 | 2023 | 5,420 | 2020 | |
| — | — | 7,672 | 2015 | |||
| 7,031 | 2024 | 12,827 | 2015 | 20,010 | 2017 | |
| 6,983 | 2024 | 6,510 | 2023 | 4,880 | 2020 | |
| — | — | 6,792 | 2015 | |||
| 6,406 | 2024 | 5,657 | 2023 | 3,640 | 2020 | |
| 6,405 | 2020 | 5,224 | 2011 | 9,702 | 2017 | |
| 6,016 | [n 11]2024 | 5,439 | [n 11]2023 | 3,360 | [n 11]2020 | |
| 6,001 | 2024 | 5,733 | 2023 | 3,327 | 2015 | |
| 5,989 | 2024 | 5,458 | 2023 | 3,700 | 2020 | |
| 5,868 | 2024 | 6,488 | 2023 | 4,483 | 2019 | |
| 5,857 | 2024 | 4,815 | 2022 | 4,158 | 2017 | |
| — | — | 5,793 | 2016 | |||
| — | — | 5,569 | 2016 | |||
| — | — | 5,490 | 2017 | |||
| — | 6,796 | 2023 | 5,230 | 2019 | ||
| 5,204 | 2024 | 5,831 | 2023 | 2,430 | 2020 | |
| 5,162 | 2024 | 6,950 | 2023 | 4,190 | 2020 | |
| — | — | 4,978 | 2014 | |||
| — | 5,851 | 2022 | 4,780 | 2019 | ||
| 4,345 | 2024 | 3,915 | 2023 | 2,400 | 2020 | |
| — | 4,895 | 2021 | 3,872 | 2016 | ||
| 3,629 | 2024 | 3,284 | 2023 | 2,730 | 2020 | |
| 3,610 | 2024 | 4,529 | 2023 | 2,250 | 2020 | |
| — | — | 3,465 | 2015 | |||
| — | 4,428 | 2022 | 3,860 | 2019 | ||
| 2,978 | 2024 | 2,217 | 2021 | 2,060 | 2019 | |
| 2,829 | 2024 | 2,998 | 2023 | 1,760 | 2020 | |
| 2,502 | 2024 | 2,227 | 2023 | 1,700 | 2020 | |
| — | 3,857 | 2021 | 2,413 | 2015 | ||
| 2,133 | 2024 | 2,061 | 2023 | 1,340 | 2020 | |
| 2,056 | 2024 | 2,247 | 2023 | 1,710 | 2020 | |
| — | — | 2,044 | 2014 | |||
| — | 4,064 | 2023 | 2,001 | 2014 | ||
| 1,860 | 2024 | 1,595 | 2023 | 1,240 | 2020 | |
| — | 2,121 | 2023 | 1,440 | 2018 | ||
| 1,421 | 2024 | 1,507 | 2023 | 1,250 | 2020 | |
| — | — | 1,242 | 2016 | |||
| 1,144 | 2024 | 1,285 | 2023 | 710 | 2020 | |
| 1,015 | 2024 | 1,108 | 2023 | 850 | 2020 | |
| 1,005 | 2024 | 1,405 | 2023 | 890 | 2020 | |
| — | 1,143 | 2023 | 820 | 2020 | ||
| 742 | 2024 | 749 | 2022 | 670 | 2019 | |
| — | — | 658 | 2016 | |||
| — | — | 562 | 2005 | |||
| — | — | 500 | 2017 | |||
| 460 | 2024 | 470 | 2023 | 270 | 2020 | |
| 443 | 2024 | 485 | 2023 | 390 | 2019 | |
| 307 | 2024 | 315 | 2023 | 320 | 2019 | |
| — | — | 300 | 2016 | |||
| 287 | 2024 | 314 | 2023 | 240 | 2019 | |
| — | — | 261 | 2015 | |||
| — | — | 206 | 2015 | |||
| — | — | 175 | 2009 | |||
| — | — | 167 | 2011 | |||
| 141 | 2024 | 161 | 2023 | 150 | 2019 | |
| 66 | 2024 | 65 | 2023 | 50 | 2020 | |
| — | — | 60 | 2004 | |||
| — | — | 31 | 2009 | |||
| — | — | 10 | 2003 | |||
| — | — | 8 | 2017 | |||
See also
- Lists of countries by GDP
- List of countries by GDP (PPP) per capita
- List of countries by GDP (nominal)
- List of countries by GDP (nominal) per capita
- List of countries by past and projected GDP (nominal)
- List of countries by past and projected GDP (PPP)
- List of countries by real GDP growth rate
- List of IMF ranked countries by GDP, IMF ranked GDP (nominal), GDP (nominal) per capita, GDP (PPP), GDP (PPP) per capita, Population, and PPP
- List of country subdivisions by GDP over 200 billion US dollars
- List of countries by total wealth
- List of countries by wealth inequality
- List of countries by income equality
- List of countries by Human Development Index
Notes
- ^ a b IMF and CIA figures exclude Taiwan and the special administrative regions of Hong Kong and Macau.
- ^ World Bank figures exclude the special administrative regions of Hong Kong and Macau.
- ^ a b c Figures exclude the Republic of Crimea and Sevastopol.
- ^ Includes Western Sahara.
- ^ Referred to as "Burma".
- ^ a b c Excludes data for Abkhazia and South Ossetia.
- ^ a b c Data is for the area controlled by the Government of the Republic of Cyprus.
- ^ a b c Excludes data for Transnistria.
- ^ a b Referred to as "West Bank and Gaza" in the IMF and World Bank reports.
- ^ CIA registers 2 separate entries for Palestine: "West Bank" and "Gaza Strip". Figures for West Bank include the Gaza Strip -- see "The World Factbook - West Bank". CIA.gov. 29 November 2022.
- ^ a b c Referred to as "Cabo Verde".
References
- ^ a b "World Economic Outlook Database, April 2024 Edition". IMF.org. International Monetary Fund. Retrieved 18 April 2024.
- ^ "What is GDP and why is it so important?". Investopedia. IAC/InterActiveCorp. 26 February 2009. Retrieved 26 July 2016.
- ^ a b c "Part 4. Applications and Limitations of ICP Data" (PDF). Retrieved 20 May 2014.
- ^ PPP Versus the Market: Which Weight Matters?, imf.org, March 2007, Volume 44, Number 1
- ^ "WEO Database, October 2023. Report for Selected Countries and Subjects: World, European Union". IMF.org. International Monetary Fund. 10 October 2023. Retrieved 10 October 2023.
- ^ "GDP, PPP (current international $)". data.worldbank.org. Retrieved 5 July 2023.
- ^ "Real GDP (purchasing power parity)". Central Intelligence Agency. Retrieved 9 November 2022.
- ^ "The World Factbook - World". CIA.gov. Retrieved 9 November 2022.
- ^ "The World Factbook - European Union". CIA.gov. Retrieved 17 November 2022.
Economic classification of countries | |||||
|---|---|---|---|---|---|
| Three/Four-World Model | |||||
| Gross domestic product (GDP) |
| ||||
| Gross national income (GNI) | |||||
| Wages | |||||
| Wealth | |||||
| Other national accounts | |||||
| Human development | |||||
| Digital divide | |||||
| Net international investment position (NIIP) | |||||